


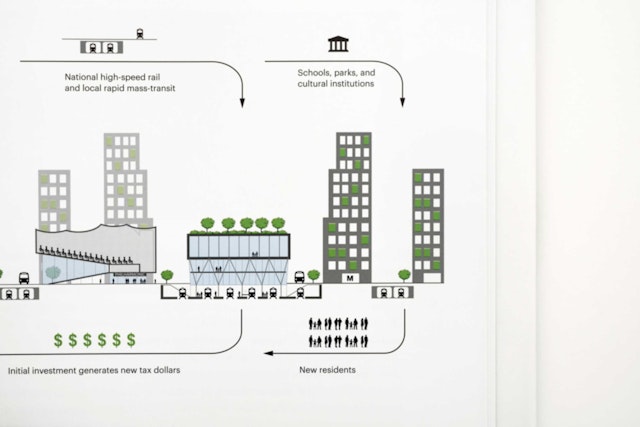
The densely packed diagrams are both informative and entertaining, with customized icons and humorous details that complement the upbeat and positive tone.


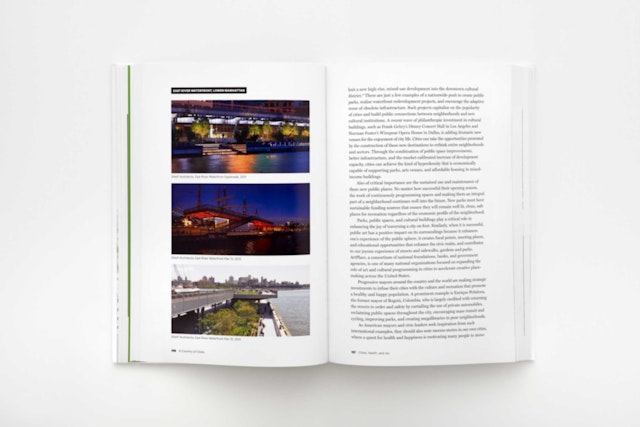
In his book A Country of Cities: A Manifesto for an Urban America, the architect and urban planner Vishaan Chakrabarti argues that well-designed cities are the key to solving many of the country's challenges, from the sluggish economy and imperiled environment to rising public health costs and growing social inequality. Chakrabarti suggests that, contrary to what many Americans believe, urban density is actually better for the health and happiness of the country, as well as of the planet, and the trend of fast-growing cities can be harnessed to create an “infrastructure of opportunity." The highly readable book was selected as one of Designers & Books' 10 Notable Books of 2013 and was the subject of a special Oculus Book Talk at the Center for Architecture.
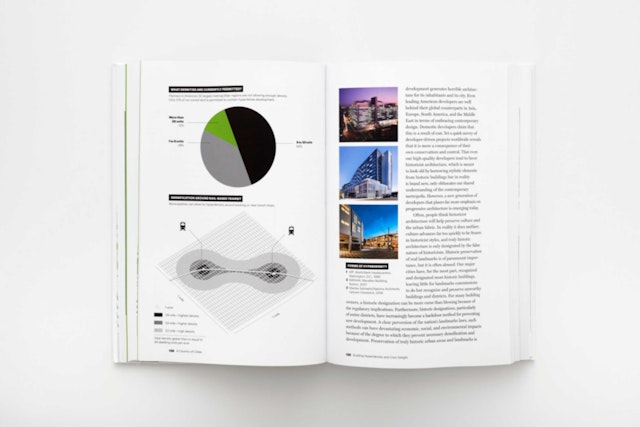
Pentagram worked on the design of the book with SHoP Architects' Omar Toro-Vaca and Ryan Lovett, and Metropolis Books publisher Diana Murphy, helping to establish a clear, cogent framework that showcases the author’s manifesto. Chakrabarti makes his case simultaneously in words and pictures: an intelligent, closely reasoned thesis, accompanied by a series of 100 diagrams and infographics that bring the thesis to life.
The charts and diagrams visualize important statistics on issues, from rising childhood obesity rates to cost comparisons of running errands by automobile versus public transit. Prior to the design of the book, Chakrabarti made a presentation to the team at Pentagram and set out his argument in visuals. The designers then helped provide art direction for the final diagrams, which were designed by SHoP, where Chakrabarti is a partner.
The infographics are a tribute to the Austrian scientist and sociologist Otto Neurath and his theory of Isotype (International System of Typographic Picture Education), a system for communicating complex ideas with pictorial diagrams. Developed in the 1920s as the Vienna Method of Pictorial Statistics, Isotype represents social, historical and technological connections pictorially to help bring statistics to life and make them more attractive and memorable. Neurath summed up the approach as, “To remember simplified pictures is better than to forget accurate figures.”
In A Country of Cities, the charts are used to help illustrate and support Chakrabarti’s themes. The densely packed diagrams are both informative and entertaining, with customized icons and humorous details that complement the upbeat and positive tone. The book closes with Chakrabarti’s manifesto to build “a country of cities”––to turn a country of “highways, houses and hedges” into a country of “trains, towers and trees”––and the book’s final infographic sums up his thesis in a double-page diagram titled “The Whole Enchilada.”
For emphasis, section titles and key points of the thesis appear throughout the book as double-page spreads of typography. The sans serif Graphik font is used in diagrams, headers, captions and display; the serif font Miller text is used in body copy.
