The data visualization project was a component of IBM’s multi-year strategy to embed design thinking and capabilities across the global organization.


Drawing on the company’s illustrious design heritage and product history, the project team explored the colors, shapes, frameworks, and combinations that would best communicate IBM branding.

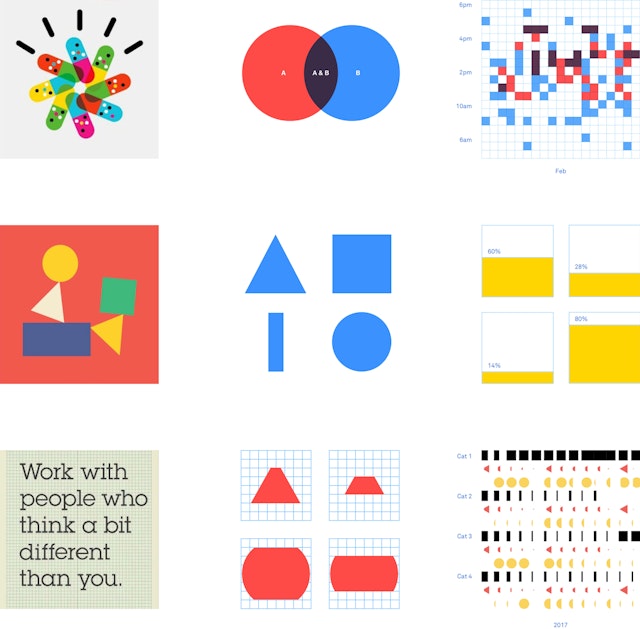
For IBM, Pentagram partner Giorgia Lupi and her former team at Accurat made it possible for more than a thousand designers spread across the globe to create data visualizations that consistently reflect the look and feel of the parent brand. The online resource provides both high-level principles and step-by-step instructions for designing charts, graphs, diagrams, maps, and graphic animations that support the distinctive IBM corporate identity.
The data visualization project was a component of IBM’s multi-year strategy to embed design thinking and capabilities across the global organization. Between 2012 and 2016, the company had flooded its ranks with designers and began to train its entire workforce—almost 400,000 employees worldwide—to think and work like designers. A vital component of the strategy was the release of the first public version of IBM Design Language. This online tool offers an extensive visual vocabulary that enables designers throughout the company to create products that look, sound, think, and perform like IBM.
To complement the core Design Language resource, the design team needed additional guidance to create visualizations based on large and complex datasets. IBM offers more than a thousand software products in service of big data, analytics, and cognitive computing, and visualizations facilitate the understanding and interpretation of data. In 2016, IBM’s head of design, Phil Gilbert, commissioned Lupi and her team to create a roadmap for data visualization design that would augment the IBM Design Language.
The project team began with research to understand the data-intensive scenarios that IBM designers would encounter. In collaboration with product groups in business analytics, IT security, drug discovery, and medical research, for example, the team developed low-fidelity prototype solutions to different use cases. By identifying typical pain points and resolving common challenges, the project team created a set of high-level design principles applicable to data visualizations for any industry. The principles outlined IBM standards for composition, visual storytelling, optimal data density in different contexts, and the use of animation and interaction to drive comprehension and engagement.
Drawing on the company’s illustrious design heritage and product history, the project team explored the colors, shapes, frameworks, and combinations that would best communicate IBM branding. Lupi borrowed and repurposed elements from computer punch cards, the Selectric typewriter, and other early IBM innovations to build the visualization vocabulary. The final guidelines include specific directions, along with original designs, animations, and interactive examples. By detailing both “do’s” and “don’ts” the guidelines help designers communicate clearly yet avoid common statistical and visual representation mistakes.
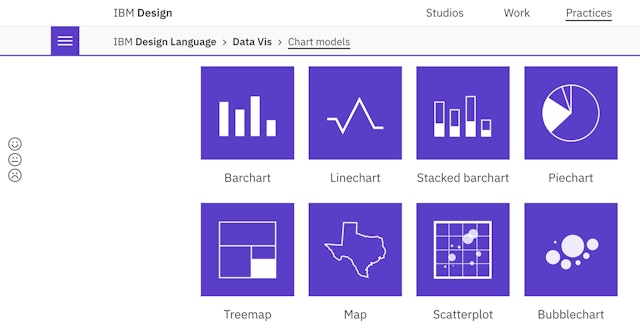
The project team ultimately compiled all of the information and organized the visual material in a user-friendly online catalog. The functional and modular Data Visualization Design Language established a shared vocabulary for producing superior data visualization design at IBM. In early 2017, the company made the guidelines available publicly as an extension of the IBM Design Language.