

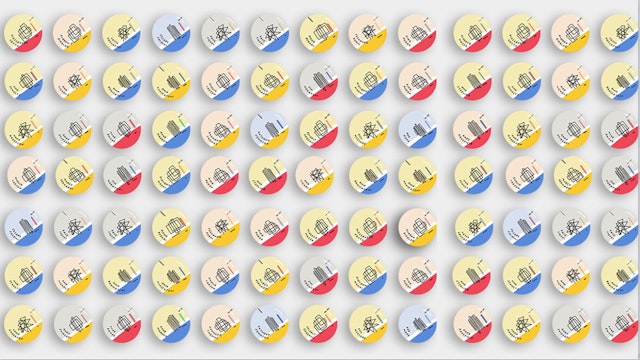
The color, position, and rotation of every element indicated a different response, creating a work of art from the analog data that makes you, you.


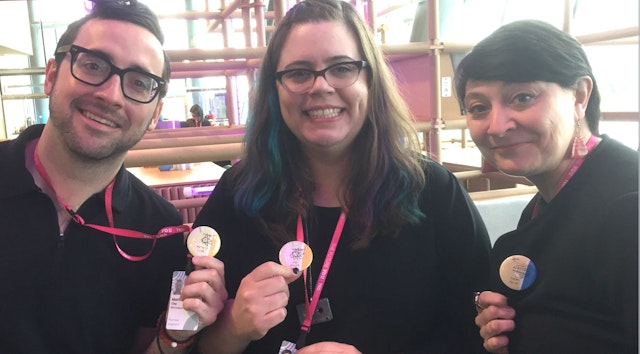
For the Target-sponsored social space at TED 2017 in Vancouver, Giorgia Lupi designed and produced unique visual Data Portraits for attendees to spark conversations and connections among them during the five-day conference. The Portraits were colorful, wearable buttons with designs derived from the attendees’ answers to simple yet evocative questions.
In early 2017, TED and David Stark Design had approached Giorgia Lupi, then at Accurat, to design a live experience for Target, a major conference partner for the past decade. David Stark Design envisioned and built a structure to activate the Target space in the foyer of the conference center. The team also wanted to include a custom intervention that would bring people together by revealing something about them.
Giorgia Lupi and the team developed a set of non-invasive, multiple-choice questions such as: “Which TED letter are you, Technology, Entertainment or Design?” “When do you get your best ideas?” “How messy is your desk?” “Do you follow the rules, or do you break them?” Giorgia then developed a design system that turned each person’s answers into a unique set of shapes, colors, and symbols to represent their views and personality. The color, position, and rotation of every element indicated a different response, creating a work of art from the analog data that makes you, you.
During breaks in the conference schedule, Giorgia worked in the Target social space, using an iPad to rapidly turn guests’ survey responses into unique, hand-drawn data visualizations. The visualizations were immediately transferred to a print server, where the on-site team put each one on a wearable button which they gave to the attendee along with a legend explaining how to read their Data Portrait.
Attendees wore the buttons over their TED badges where the data visualizations served as ice-breakers and sparked more interesting conversations than the typical “what do you do” introduction. Qualitative and analog at its core, the data-driven experience proved to be more meaningful than mere statistics or other information that might have been harvested automatically.
Anticipating a large number of potential button requests, the creative team preemptively designed and developed a tablet app that automated the process of generating the Data Portraits. The app faithfully replicated Giorgia’s design, style, and even calligraphy. At the busiest times, this allowed people to decide whether to wait in the queue for the designer’s personal touch or to get an authentic automated version of their Data Portrait in a matter of seconds. Either way, the attendee walked away from Target’s space with both physical and digital copies (via email), each accompanied by a legend and ready to be shared online.
Giorgia began the process of imagining and defining the visual language for the Data Portraits with sketches on paper and went through multiple iterations before settling on the final vocabulary. The tablet app developed by Accurat used web technology to replicate Giorgia’s design style and was deployed on the cloud, which made it immediately accessible on many devices at the same time.
The creation of more than five hundred Data Portraits during the conference illustrated how the representation of soft/ small data could be an effective way to promote connections among people. When asked the last question of the survey (“The future is…”), a wide majority of attendees said that the future is “bright.” Target once again affirmed itself as the TED partner who brought people together and made them think.
