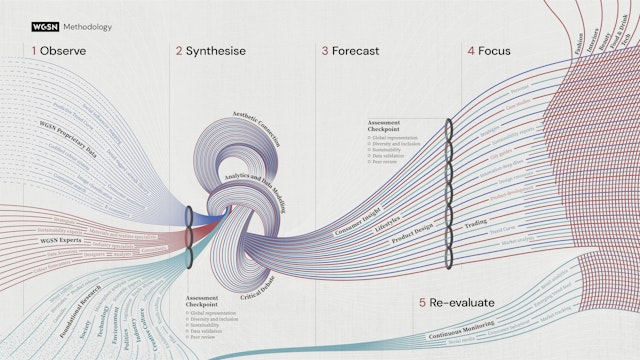
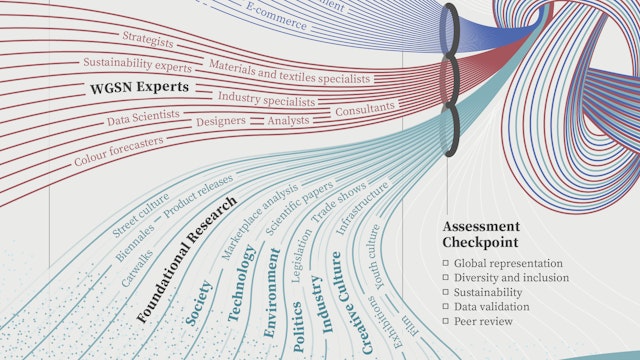
The visual mnemonic outlines the structure of WGSN’s rigorous approach to make it more accessible to potential clients.


WGSN is the world’s leading consumer trend forecaster, providing trend insights, curated data and industry expertise to help its clients understand consumer behavior and lifestyles. Pentagram partner Giorgia Lupi and team have helped give shape to the company's proprietary methodology by designing a dynamic data visualization.
Trend forecasting can seem more like an art than a science, and the challenge for the designers was to explain the rigorous process behind WGSN’s analysis to potential clients. The custom visualization helps to codify the steps and structure of this framework—what are the phases, the myriad inputs, and the resulting conclusions—without giving away too many trade secrets.
The team developed a visual mnemonic that works as both a static diagram and as an animation. Channels of diverse data flow through five different phases (Observe, Synthesise, Forecast, Focus, Re-evaluate) and two assessment checkpoints to emerge as actionable objectives such as product development, market tracking and retail analysis. The swirl of “Synthesise” interweaves aesthetic connection, data modeling and critical debate to point the way to the future. The expressiveness of the drawing reflects the ingenuity and accessibility of WGSN’s approach and demonstrates why the company is the leader in its field.
