


The installation design updates the concept of a cyclorama, an immersive panoramic image viewed from inside a cylindrical room.


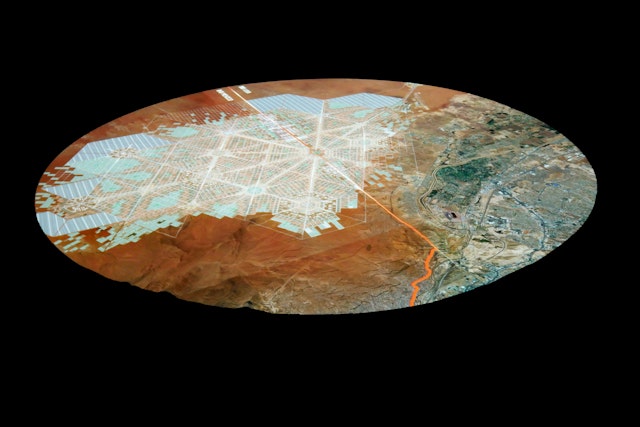


The continuous sequence progresses from a global to a granular view, presenting data about the world’s mega-regions before focusing in on the U.S.-Mexico border and Ciudád Juarez (in Chihuahua) and El Paso (in Texas) in particular.


Building a wall between the U.S. and Mexico was a focal point of the 2016 U.S. presidential election. The idea has turned attention to the border between the two countries, but ignores the point that they coexist in a complex synergy. Pentagram collaborated with FR-EE / Fernando Romero Enterprise, BuroHappold and SuperUber on the design of ‘Border City,’ the Mexico installation at the inaugural edition of the London Design Biennale, presented at Somerset House. Instead of a wall, the exhibition proposes a concept for a truly binational city that offers a new model for a rapidly developing world as populations grow, migration increases, and economies continue to globalize.
The installation was a response to the official Biennale theme, “Utopia by Design.” FR-EE’s prototype for the Border City is based on a hexagonal plan that expands radially to optimize distances and maximize efficiencies for urban planning. Pentagram created animated infographics for the installation that vividly illustrated the concepts, science and data behind the masterplan, which is proposed for an area between the three bordering states of New Mexico, Texas and Chihuahua.
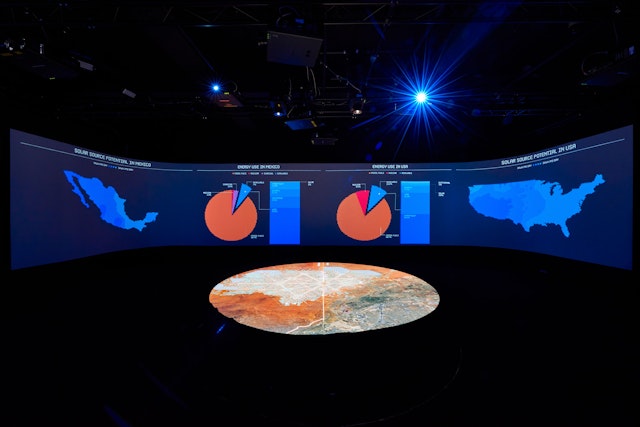
The installation design updates the concept of a cyclorama, an immersive panoramic image viewed from inside a cylindrical room. A circular dimensional model of the Border City prototype was displayed in the center of the rectangular gallery, which was built out with rounded corners. An animated projection on the model detailed how the adaptable hexagonal grid can provide a beneficial framework for land use, transportation, water systems and other factors that improve quality of urban life. The idea was illustrated and amplified by the dynamic graphics projected on the walls, which wrapped around and filled the room from floor to ceiling and in 360 degrees with information about the Border City proposal and the region at large.
Expanding on the defining element of the masterplan, the graphics are all designed on a hexagonal grid. This extends to a custom typeface, Hex Grid, which features letterforms built around hexagonal geometry. The attention to detail helps create a cohesive experience of the prototype, demonstrating the viability of Romero’s vision. SuperUber collaborated on the animation and projection of the graphics.
Pentagram worked with FR-EE to develop the narrative of the motion graphics and determine which information to highlight. The continuous sequence progresses from a global to a granular view, presenting data about the world’s mega-regions before focusing in on the U.S.-Mexico border and Ciudád Juarez (in Chihuahua) and El Paso (in Texas) in particular. The infographics create a powerful portrait of the region as told through pressing issues and topics, including overviews of immigration, urban growth and slum populations, and comparisons of factors such as border crossings, access to healthcare, drug consumption and crime statistics.
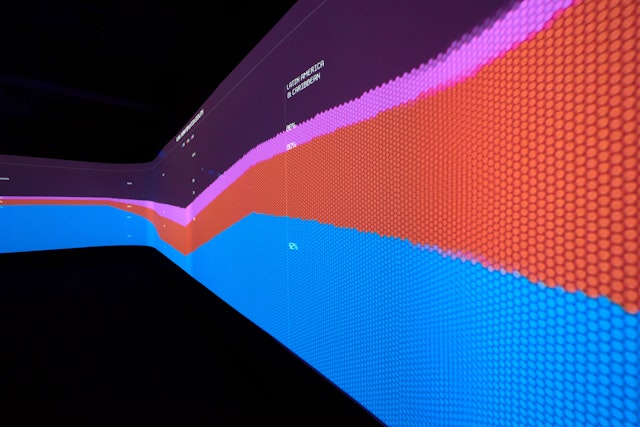
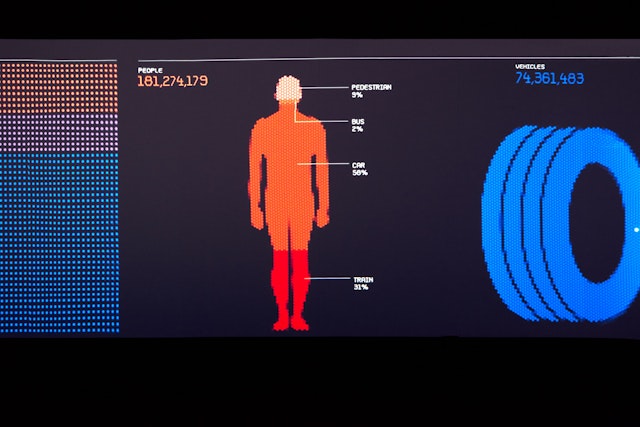
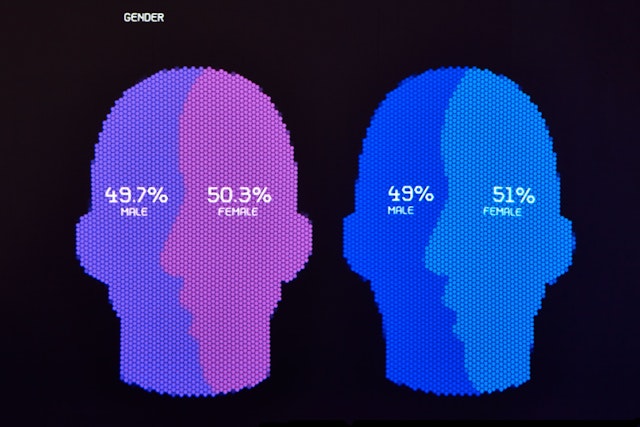
Hexagonal shapes are used as units to represent populations in the charts and graphs, and as the pixels that make up photographic images. The infographics have been designed to be quickly understood, taking on easily recognizable shapes of icons and symbols related to the subject at hand. An immigration bar chart suggests the stripes of the U.S. flag, and a comparison of data on border crossings on foot and by car appears in the form of a human and a tire, respectively.
The complete sequence makes the most of the all-around presentation, building a back-and-forth conversation between two screens on the long sides of the room, with one introducing a subject and the opposite responding in kind. The element of motion is used to capture the push and pull of movement across the border, with images and waves of graphics stretching across the two sides of the room, and population centers continually expanding on a heat map of the world.
Pentagram previously designed the FR-EE identity and website.
Sector
- Arts & Culture
Discipline
- Digital Experiences
- Exhibitions
- Data Driven Experiences