
The visualization needed to be memorable, visually arresting and easily understandable for policymakers in government.


As the United States grapples with how to best contain Covid-19, new types of technology can quickly and efficiently locate the source of disease spread within communities. The Covid-19 Technology Task Force, a volunteer coalition of public health, tech, business, and academic leaders, was recently formed to explore and advocate these types of solutions to governments. The committee commissioned Giorgia Lupi and her team to create a visualization that illuminates the potential of digital technology to speed contact tracing and help quickly isolate sick individuals.
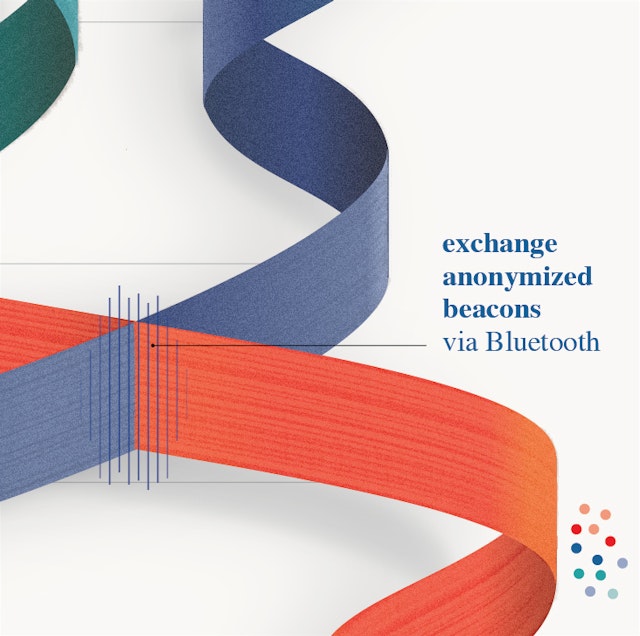
The visualization focuses on “exposure notification” (EN) contract tracing, a digital type of contract tracing that uses bluetooth to anonymously track and trace an infected individuals’ potential contacts with others via a mobile app. While manual contact tracing—a laborious process of calling by telephone someone who has a disease, and then calling all of their known contacts that may have been infected—has been used with great success in previous pandemics, EN can even more rapidly notify people that they may have crossed paths with someone who is infected. And because EN does not use GPS or record individual locations, the technology also preserves individual privacies (a major concern for these types of disease surveillance programs).
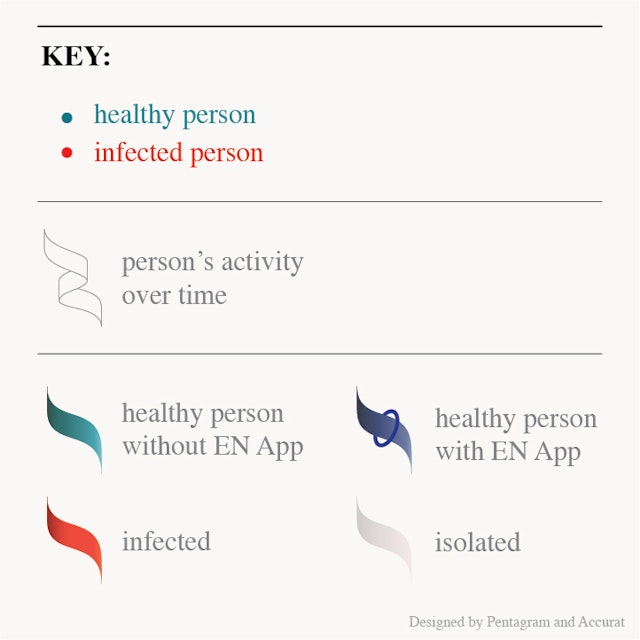
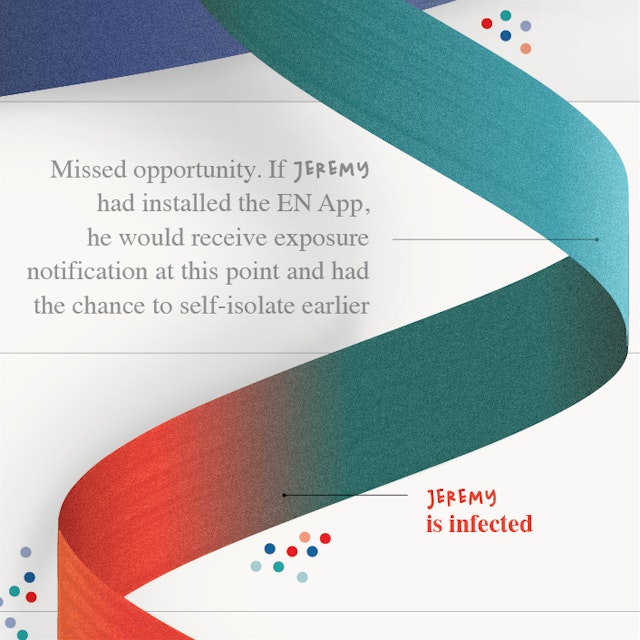
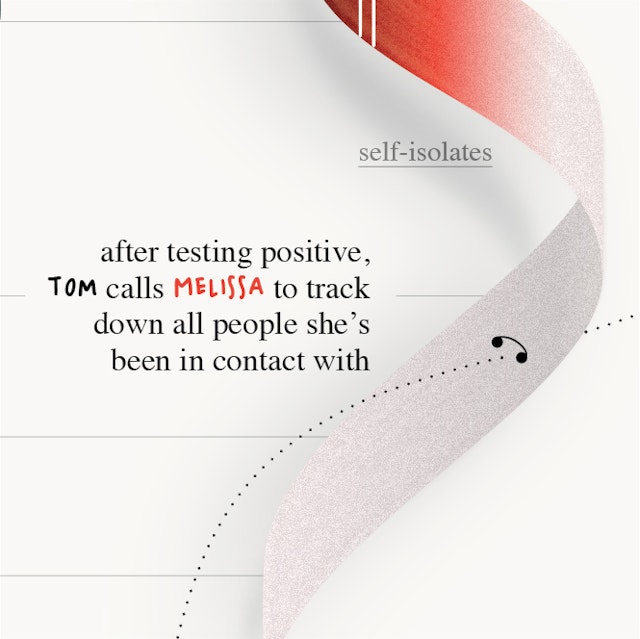
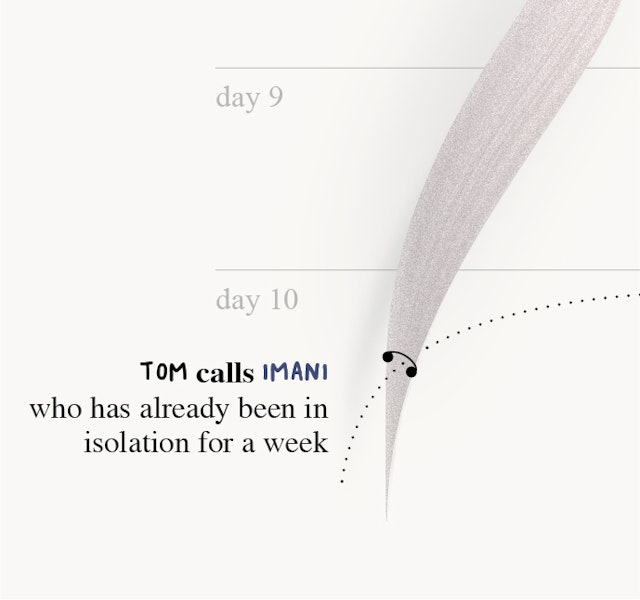
The visualization needed to be memorable, visually arresting and immediately understandable for busy policymakers in government who were the Covid-19 Technology Task Force’s intended audience. The design team began by creating a hypothetical scenario of disease spread, and placing that scenario on a vertical timeline. Three undulating ribbons serve as memorable and accessible metaphors for the primary actors in the scenario: an infected person who installs the EN app, a person who becomes infected and does not have the app, and then a person who self-quarantines as a result of receiving a notification that they may have come in contact with a sick person. As time progresses, the reader can understand the relative benefits of EN as compared to purely manual contact tracing. The graphic also shows how these two strategies might work together to provide a multi-pronged response to a fast-moving virus like Covid-19.
A major goal of the visualization was to connect this complicated and often opaque technological process to real-life behavior and events. Small dots are used to represent other individuals who may have been in contact with the three primary ribbons, and whether they’ve become infected. Captions throughout add further narrative context, clearly underlining how exposure notification can save lives.
