The visualizations highlight small but mighty numbers that are helping to make a change in the world.


The charts combine hand-drawn type and infographics with photo snapshots, using information as a lens on current events.


Like all of us, Pentagram’s Giorgia Lupi and team have felt overwhelmed by the events of 2020. With difficult news arriving almost daily, the designers decided to focus on the positive and started working on Happy Data, a series of hopeful views of the world through data and drawings. The visualizations combine hand-drawn type and infographics with photo snapshots taken by the team and their friends, using information as a lens on current events.
The self-initiated project was conceived in response to twin crises: the global pandemic of Covid-19, which necessitated much of the world to go on lockdown and set off the worst economic recession since the Great Depression; and the killing of George Floyd and the epidemic of police brutality against Black people in the US, which was answered by massive protests supporting the Black Lives Matter movement.
When Covid-19 hit her native Italy and then the US, Giorgia and her team found it nearly impossible to escape thinking about the pandemic. Everywhere they looked, they were reminded of the virus’s painful disruptions. As they continued to self-isolate at home, they found themselves daydreaming out the window, imagining what the future might hold.
Inspired by these window-side daydreams, the team started searching far and wide for Happy Data: small but mighty numbers that, while insignificant to the more urgent statistics about the virus’s toll, helped picture a new reality post-pandemic. Then, using windows at home as canvases, they visualized this data to create metaphorical “views” onto a more joyful and positive future. Like much of Giorgia’s work, the project utilizes the principles of “data humanism”––using data to uncover the human stories behind the numbers and statistics, and to challenge the idea of data as something that is impersonal and intimidating.
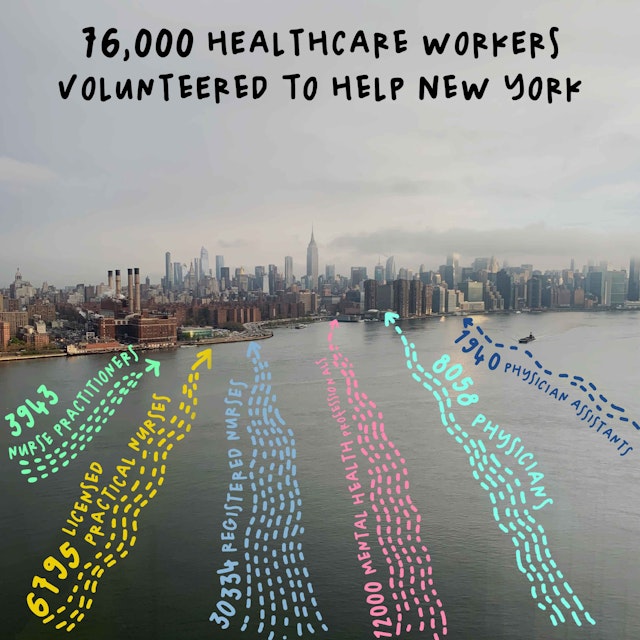
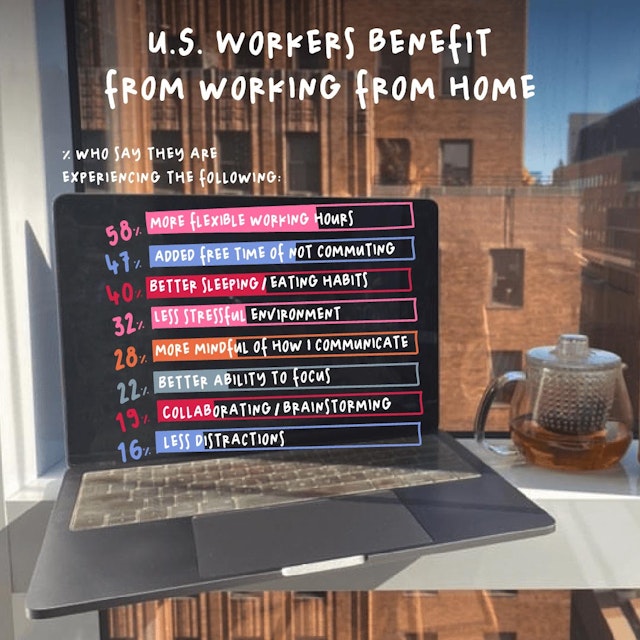
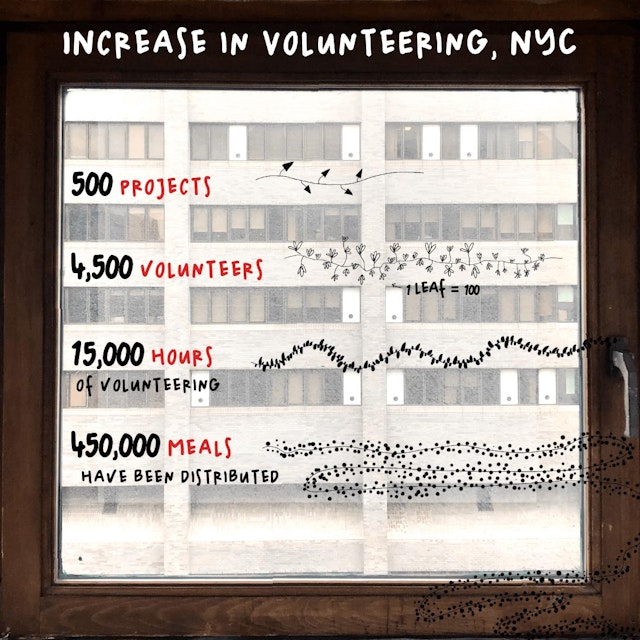
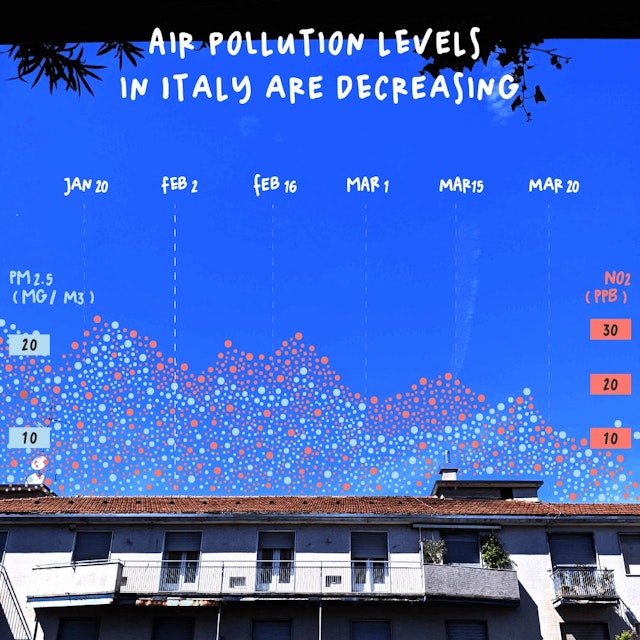
The Covid-19 visualizations have featured data related to topics including the number of healthcare workers who traveled to NYC to help fight the pandemic, the increase in volunteering, the benefits of working from home, and the positive impact on the environment as people shelter in place during the lockdown.
Giorgia and team originally started the project to share uplifting data with the world about the fight against Covid-19. But with the tragic murders of George Floyd, Breonna Taylor, Ahmaud Arbery and Rayshard Brooks, as well as instances of police brutality against Black people across the country, the designers decided to shift the focus and take time to reflect on the moment, educate themselves and continue to use the platform to support and amplify the good work of others, in the Black Lives Matter movement and beyond.
These visualizations looked at data related to the increase in public support for Black Lives Matter and the ways in which people were taking action in support of racial equality, legislative responses to policing, and donations to bail funds in support of the movement.
Giorgia and her team will continue developing Happy Data to reflect current events. Viewers are invited to explore the visualizations and share their own views and data at happy-data.co.
The project has been covered by Fast Company, Creative Review and PAGE.
Office
- New York
Partner
Project team
- Sarah Kay Miller
- Ting Fang Cheng
- Talia Cotton
- Phillip Cox
